Data Engineering projects
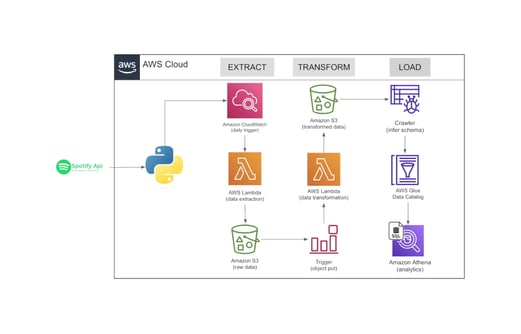
Spotify ETL Pipeline
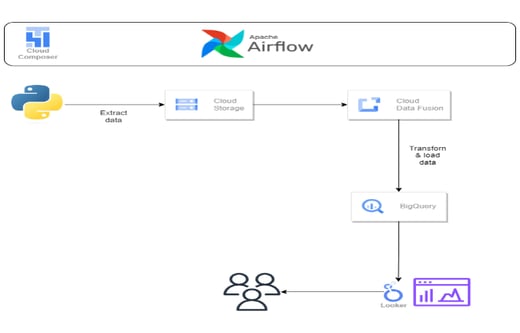
Automated reporting Pipeline
Designed and deployed a fully automated pipeline using AWS to harness music streaming data from Spotify’s API. The raw data is transformed using AWS Lambda, securely stored in S3, and automatically cataloged into a Glue Database via Glue Crawlers. For querying and analysis, Amazon Athena enables fast, serverless SQL over the structured data. Weekly triggers to update data
Leveraged Google Cloud to build a seamless, secure, and automated sales data pipeline. From storing raw files in Cloud Storage to transforming data with Cloud Data Fusion (masking sensitive info and hashing passwords), the pipeline flows into BigQuery for fast querying. Looker Studio turns the numbers into insights, while Cloud Composer keeps the entire workflow orchestrated.

ETL Pipeline for automatic transaction reporting
I used GCP's services to create a sales report.
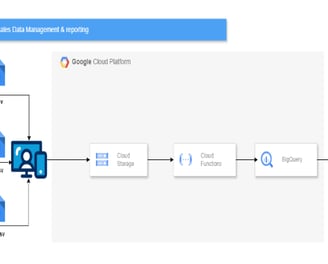
Web portal was used to upload data in the form of CSV files and Cloud Storage was used to store the data.
Cloud Functions were used to transform the data and load the data onto Google Big Query.
Looker studio was used to turn data into actionable insights.
Data Analyst projects
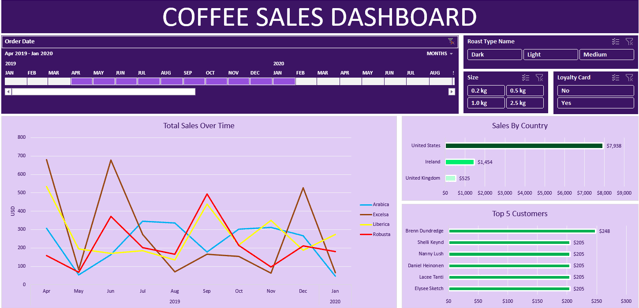
Coffee Sales Dashboard
Processed 200,000+ transaction records to uncover key business trends and insights.
Utilized SQL Workbench for data cleaning, transformation, and in-depth performance analysis.
Developed an interactive dashboard with 7+ key performance indicators (KPIs) to track revenue, profit margins, and contribution metrics.
Integrated dynamic filters for year-wise and month-wise comparisons.
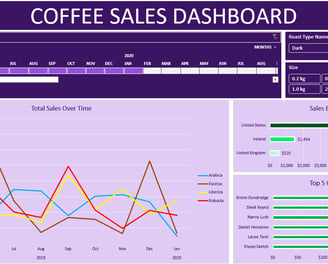
Analyzed 30,000+ coffee orders across multiple countries to identify customer preferences, sales trends, and product performance.
Cleaned and transformed raw transaction data in Excel, enabling accurate aggregation and customer-level insights.
Built a dynamic dashboard tracking key metrics including sales volume, revenue, coffee type distribution, and customer loyalty.
Implemented interactive filters for roast type, coffee size, region, and time period, enhancing user-driven exploration.
Highlighted top-performing customers and product combinations to support targeted marketing and upselling strategies.
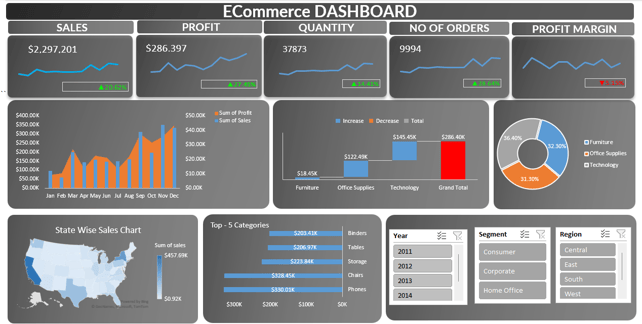
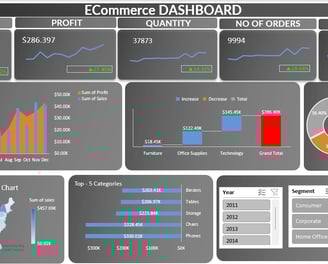
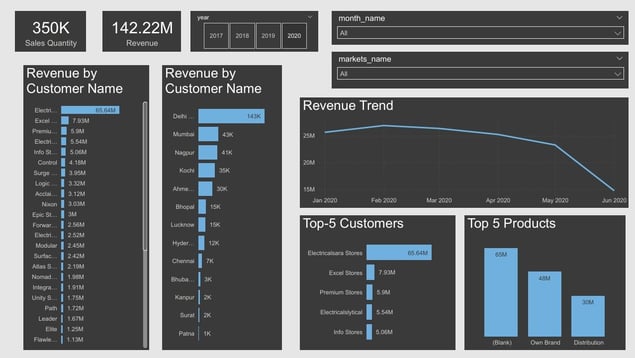
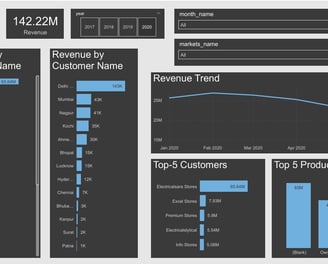
Business Performance Dashboard – AtliQ Hardware
Processed 25,000+ eCommerce transactions to uncover consumer behavior patterns and regional sales trends.
Utilized Excel to clean, filter, and structure order data across demographics, product categories, and shipping locations.
Designed a multi-page dashboard featuring insights on sales by region, age group, gender, and product category.
Integrated interactive visuals to analyze B2B vs. B2C orders, monthly purchase trends, and top-selling items.
Enabled stakeholders to make data-driven decisions through dynamic filters for year, category, and state-wise sales performance.